CGDV COVID-19 Challenge Submission Guidance
Participants should follow this step by step instructions on uploading visuals to CGDV platform. Incomplete submissions will not be considered. If you have any questions, please send email to datachallenge@qedgroupllc.com.
Step 1
Go to Center for Global Data Visualization, create an account and complete the profile with a photo. Then start your submission through “My Visuals” button on the top right.
Step 2
Fill out ALL information in the form otherwise your submission won’t be considered:
- Visualization Title: Enter title of your visual.
- Visualization Country: Enter country you are located at.
- University or Organization: For student, choose the university you are currently attending to. For profession, choose the organization you are currently working for. If you don’t find your university or organization in the list, choose other at the bottom to add.
- Category: Choose the appropriate category for your submission.
- Challenge: Please select COVID-19.
- Data Source: Enter link of data source you used for the visual and use comma to separate multiple sources.
- Tags: Enter tag of your visual and use comma to separate multiple tags.
- Participant Team Type: Select either a student or professional track.
- Embed, Description: Find more details in Step 3 and Step 4 below.
- Allow Comments: Check if you allow comments for your visual from other CGDV users.
- Multiple Users for this Submission: Check if you are working with other people in the challenge, then select name of your team members. Each team should only make one submission but please make sure that all team members are registered as CGDV users.
- Visual’s cover picture: Find more details in Step 5.
Step 3 Upload your visual
Under Embed, you will find 3 options to upload your visual: Source, Embed url, Document
Source
If your visualization is in any site hosting service such as GitHub Pages, select Source and put the URL in the box after Embed.
For visualization webpage with embed code, you can also follow the instructions in Embed url section below to upload your work.
Embed url
If your visulization tool provides code for embedding your interactive data visualization, select Embed url and add embed code in the box after Embed.
You can find some examples to locate the embed code below:
Google Slides
If you have multiple graphs and not familiar with web development, you can create your visualization story using Google Slides and embed it on CGDV by putting following embed code into “Embed Code” section. Please replace “GOOGLE SLIDES SHARING LINK” to your own sharing link and keep quotation marks outside.
<iframe width="1200" height="800" frameborder="0" src="GOOGLE SLIDES SHARING LINK"> </iframe>
Visual built with visualization platform
- Tableau
Publish your visual to Tableau public. Find the share button ![]() under your visual.
under your visual.
Find the embed code.
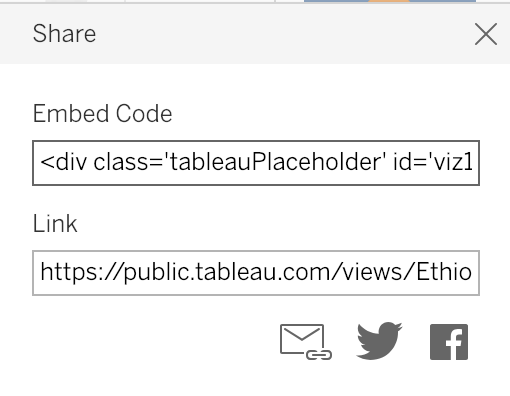
Copy and paste embded code into embed code box on CDGV.
- Plotly
Find the share button ![]() in your Plotly visual.
in your Plotly visual.
Find the iframe embed code.
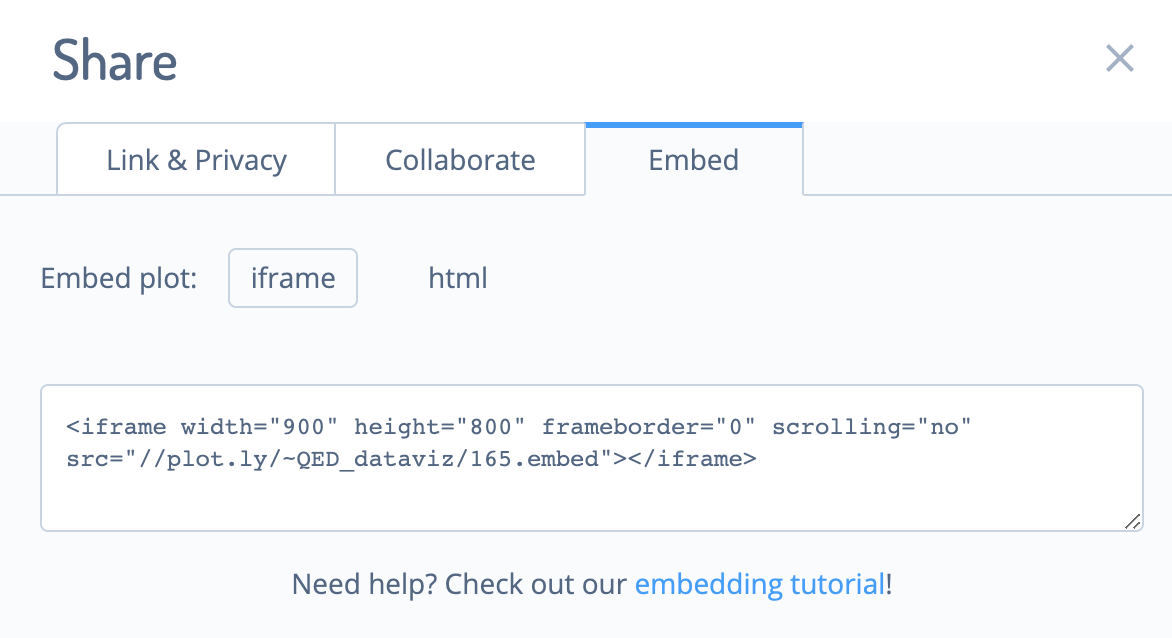
Copy and paste embded code into embed code box on CDGV.
If your plotly visual is interactive, please use the public URL from Link & Privacy to upload your submission.
- Flourish
Publish your Flourish visual.
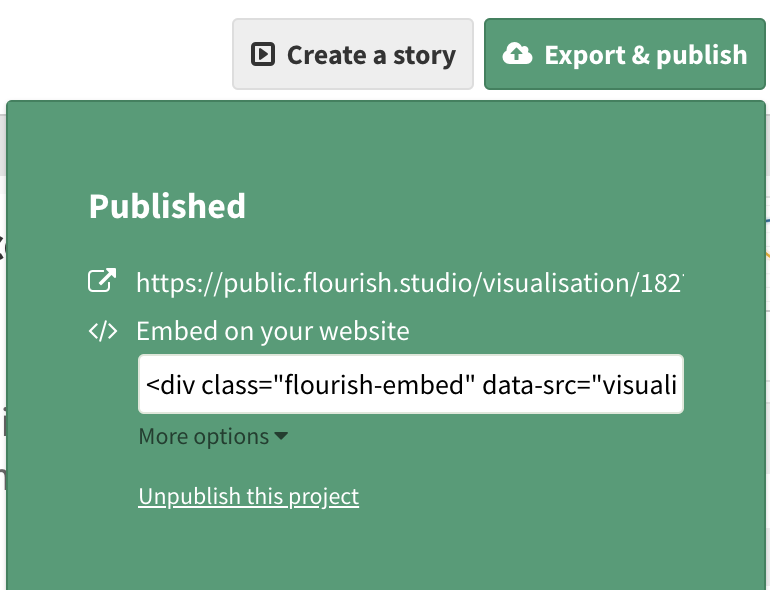
Under “More options”, find the iframe embed code.
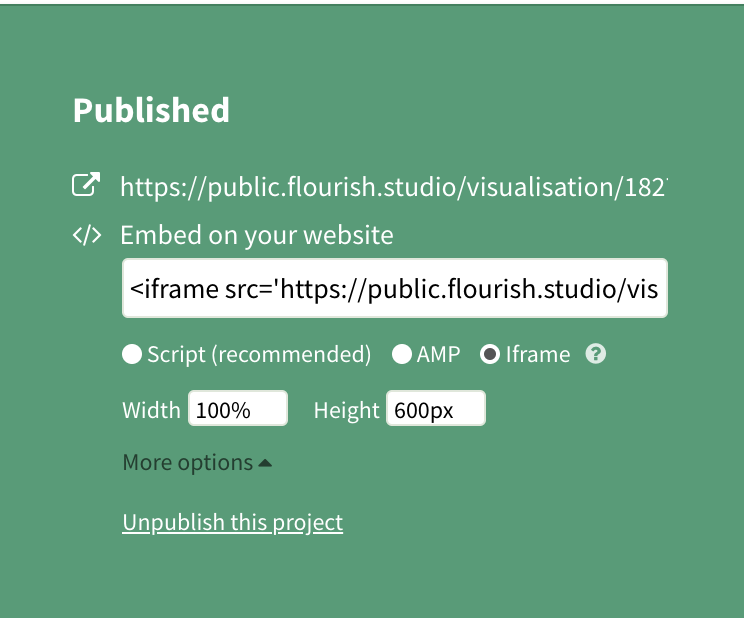
Copy and paste embded code into embed code box on CDGV.
Customized visualization
If you created advanced visualization using tools such as D3. Please upload your visualizaton to your own Github page, and use iframe tag (e.g.(
<iframe width="1200" height="1500" frameborder="0" src="your visual source"> </iframe>
) in embed code section on CGDV.
Document
If your visulization is in static format such as word, pdf or excel, select Document and use the Choose File button to upload files. Remember to click Upload after choosing a file. You are allowed to upload one or multiple files.
Step 4 Upload your code and supporting files
For this challenge, we require participants to submit codes that are used for data wrangling and a supporting document. Your supporting document must provide a brief description of the steps taken during your data analysis process/data Viz tools, (if applicable, any statistical methods you have used along with model accuracy/model performance) and you must provide a brief interpretation/conclusions of your results/visualization. Do not exceed 2 pages (700 words). One page is preferred. Codes will be assessed during an initial Quality Assurance process to prevent any data misinterpretation.
If you upload your visual using either Source or Embed url in Step 3, upload the code and supporting files to a file storage platform such as Google Drive. Copy and paste the shareable link into the Description box below. Please make sure anyone with the link can view and download the files. But don’t give access to edit.
If you upload your visual using Document in Step 3, simply upload the files along with your visualization.
Step 5 Upload a visual cover picture
Upload a cover picture for your visual. Your cover picture along with your visulizaton title will be presented in the CGDV Library as a submission entry.
Step 6 Double check your submission
Go to “My Visuals” on CGDV, scroll down and you should see you submission. Go into your submission and make sure everything looks good.