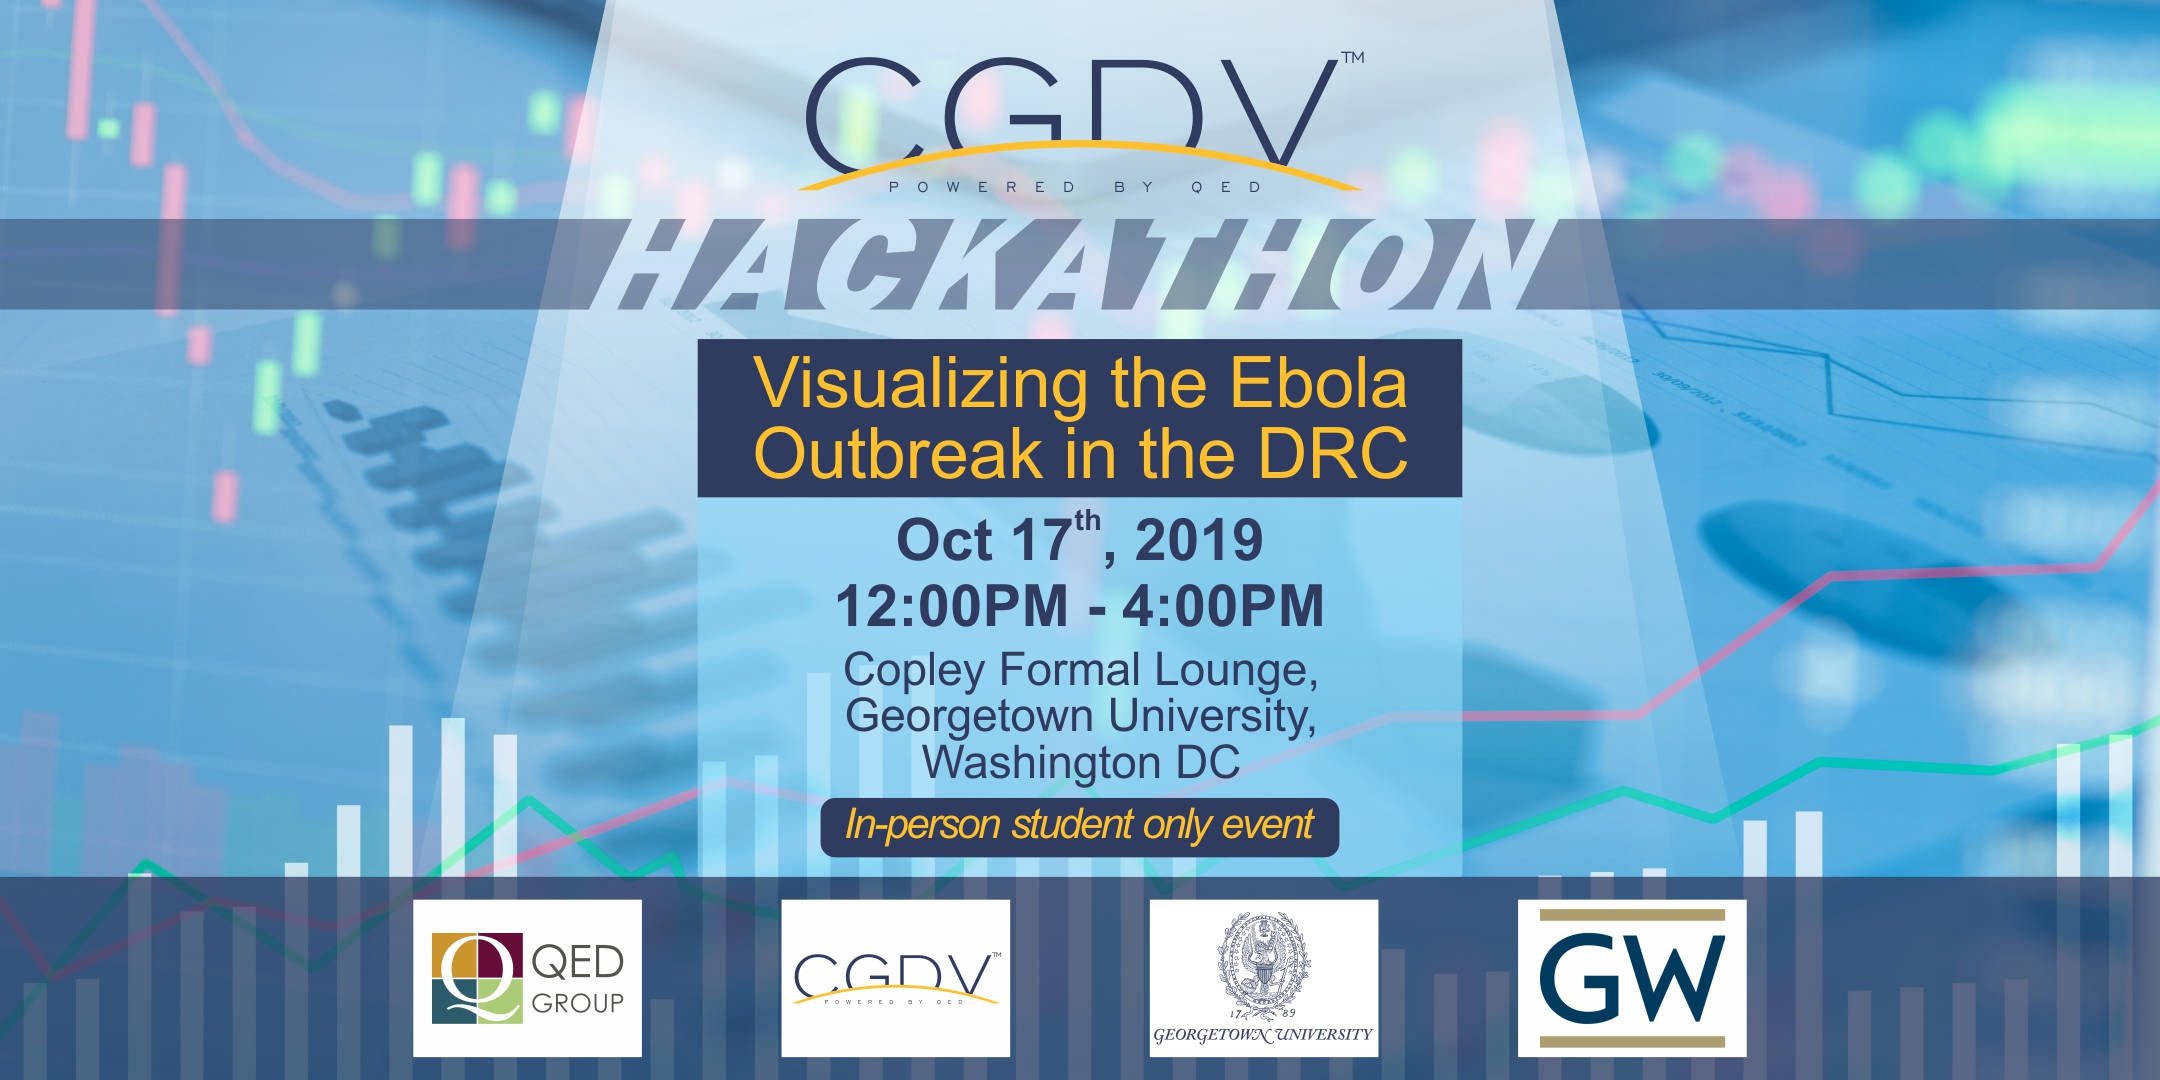
Visualize the Ebola Outbreak in the DRC
The Center for Global Data Visualization (CGDV)
, powered by QED, and in collaboration with Georgetown Data
Analytics, George Washington Data Science, and the Tableau
Foundation invite you to take part in a data visualization
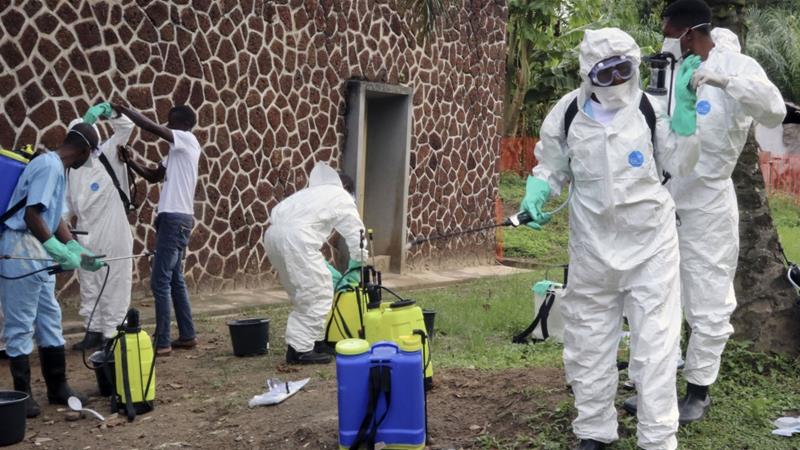
hackathon to help stamp out the Ebola outbreak in the DRC.
The Hackathon will bring together teams of participants from
across the world to demonstrate the power of open data for
public good. Teams will assess, analyze and visualize data and
present to an audience to communicate a recommendation, story,
or new idea through data visualization. This allows for better
decision-making and more varied solutions to problems that
span a wide range of public health topics.


