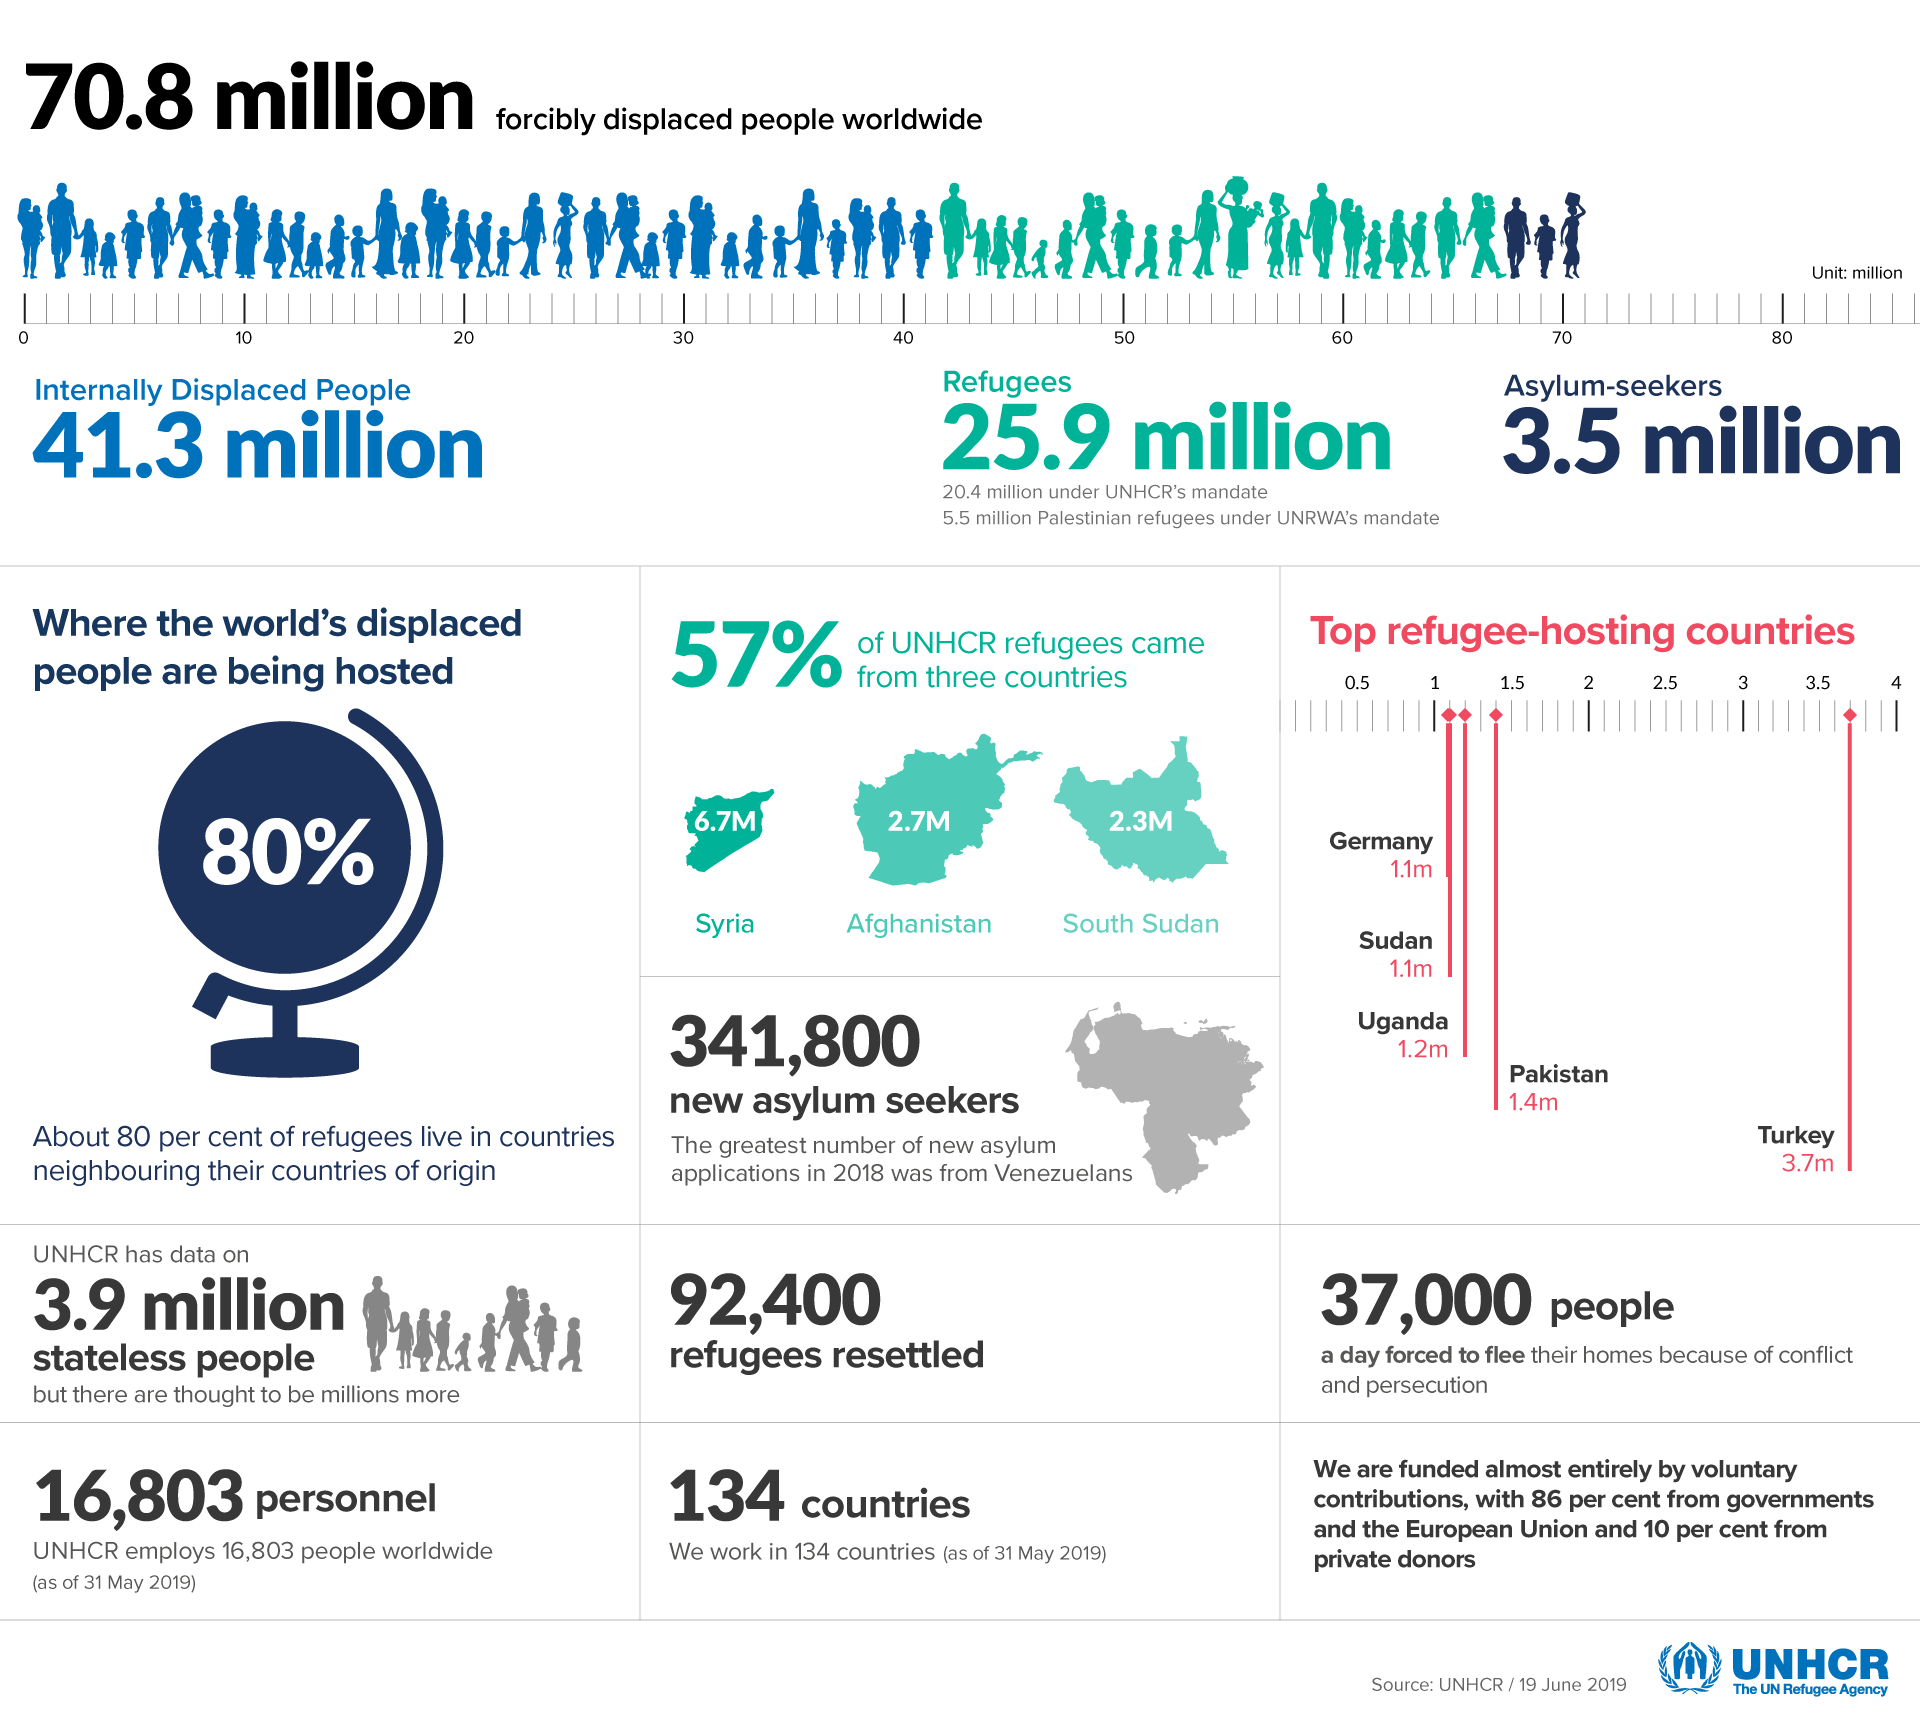
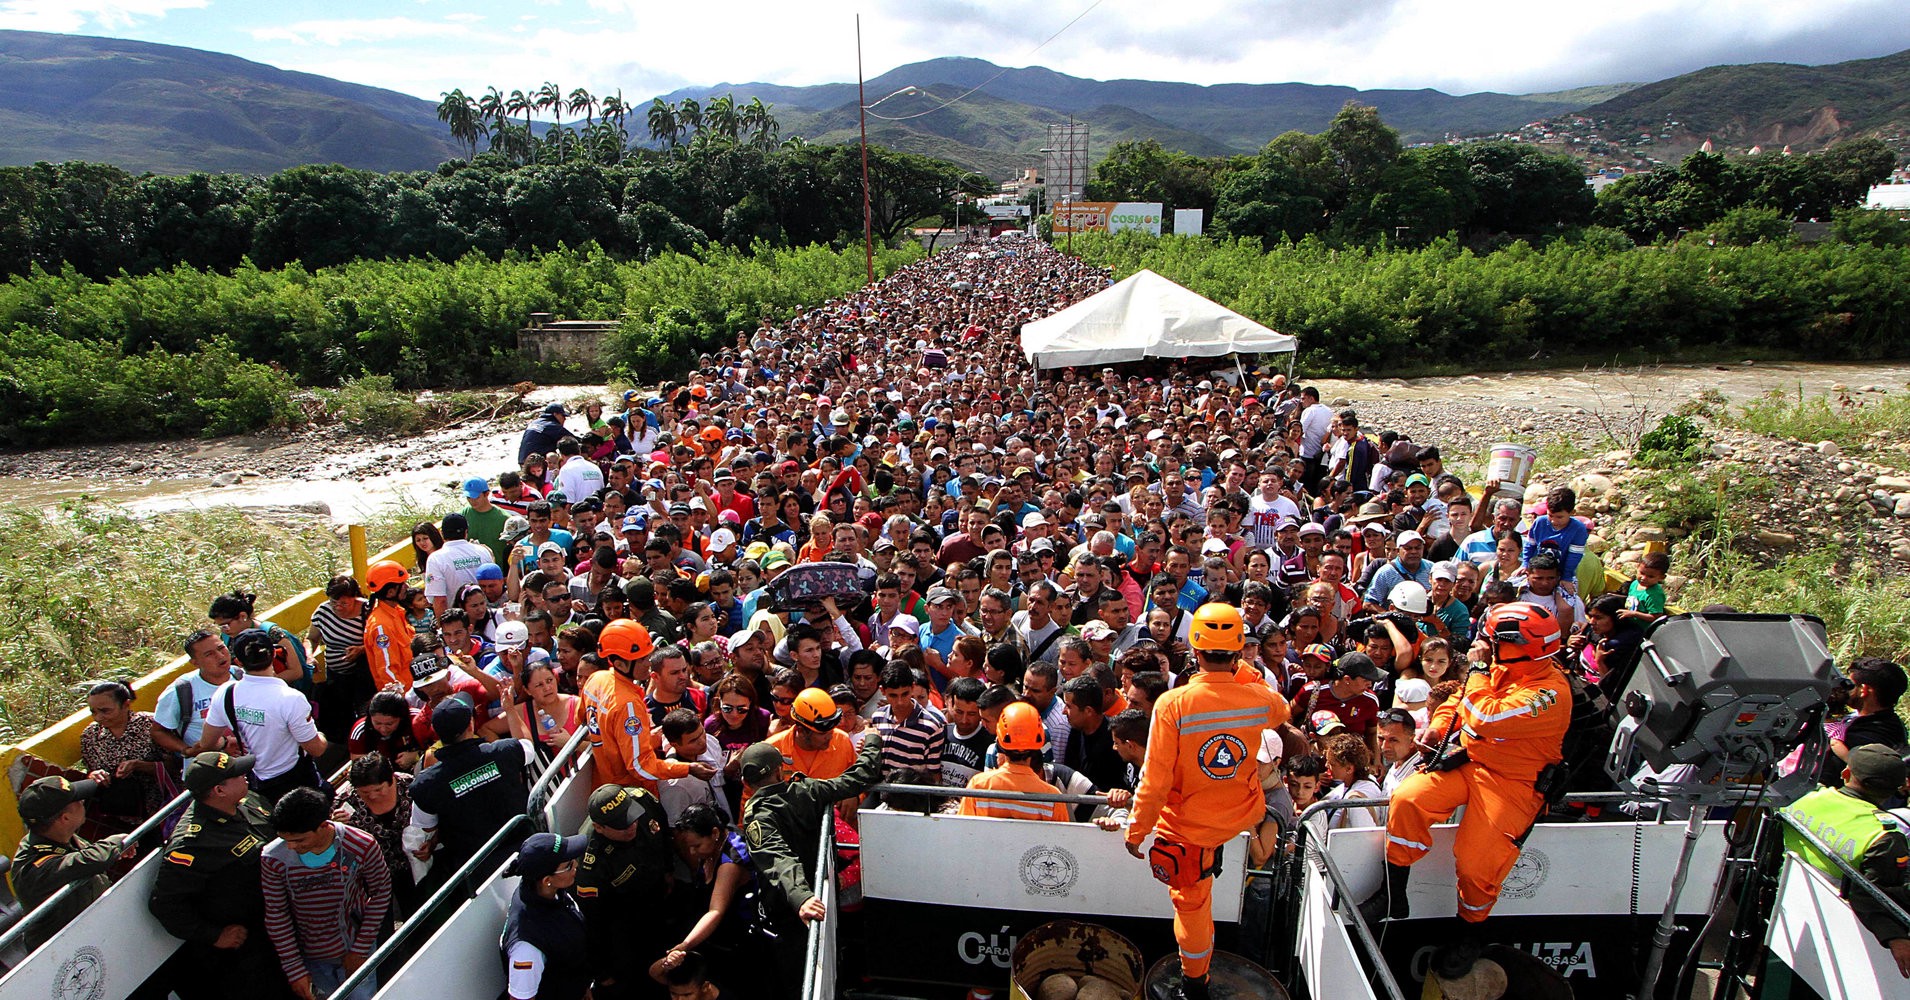
Visualizing the Refugee Crisis

The Center for Global Data Visualization (CGDV) powered by QED, and in collaboration with the Tableau Foundation, Georgetown University Department of Analytics, George Washington University Department of Data Science, Boston University School of Public, Delhi University, Makerere University and Addis Ababa University, invite you to take part in a week-long online data visualization hackathon to provide insights into the global refugee crisis.
The Hackathon will bring together teams of participants from across the world to demonstrate the power of open data for public good. Teams will assess, analyze and visualize data and present to an audience to communicate a recommendation, story, or new idea through data visualization. This allows for better decision-making and more varied solutions to problems that span a wide range of public health topics.

What is a Data Visualization Hackathon?

A data visualization hackathon is a design sprint-like event in which people collaborate intensively on data visualization projects.

Find Out More About Our Previous Hackathon at George Washington University

Who can participate?

Everyone!

What’s required?

A computer or laptop with your favorite tools installed. You can use whatever tools you like! (Excel, Adobe, Python, R, JavaScript, Tableau, Plotly, etc.)

Why should I participate?

In addition to the chance to earn prizes you’ll be able to develop a visualization that showcases a fresh perspective on data, opens up new feedback loops, informs policy, and improves program implementation for the public good!

When?

Sat, Oct 19, 2019, 12:00 PM – Sat, Oct 26, 2019, 12:00 PM EST

Where?

Online at The Center for Global Data Visualization (CGDV)

What is the Refugee Crisis?


Learn More About Refugee

Hackathon Task

Visualize worldwide, regional or country-specific refugee situations, perform exploratory analysis and give insights from the data.

Judging Criteria

  • Data storytelling 25%
  • Quality of exploratory analysis 25%
  • Insight from data 25%
  • Design and layout of data visualization 25%

Data

The key data sources are provided below, and any additional data sources can be embedded in the data visualization if they are public and available to everyone.

Submit

Register an account on CGDV, and submit your work before 12:00 PM EST Oct 26th, 2019.

How To Upload Your Visual to CGDV?

Team Up

Find your friends and form a team of up to 4 members

Prize

First Place: 200 USD
Second Place: 50 USD

Judges

Dr. Brian Bingham

Team Lead, Center for Development Research, USAID

Heather Connor

Assistant Director, MS Analytics Program, Georgetown University

Dr. Feras Batarseh

Assistant Teaching Professor, Data Analytics Program, Georgetown University

Dr. Vincent Kiberu

Research Associate, Masters of Health Informatics Program, Makerere University

Dr. Altin Ilirjani

Senior Global Health Data Strategist, Bureau for Global Health, USAID

Dr. Alka Kacker

Associate Professor, Hansraj College, University of Delhi

Reema Rustagi

Senior Data Scientist, Data Hub Team, The QED Group LLC

Rob Segan

Deputy Director, Global Health and Data Solutions, The QED Group LLC

Elijah Meeks

Data Visualization Engineer at Apple, Executive Director and Founding Member at Data Visualization Society

David Bohl

Senior Researh Associate, Pardee Center for International Futures

Mickey Rafa

Assistant Director of Research Operations, Pardee Center for International Futures

Result

Results will be announced on November 8, 2019

Check out all the submissions!

Try Tableau For Free!